Mike LaFirenza
The COVID-19 pandemic has put unprecedented strain on the U.S. health system over the last two years. With hospitals and providers facing heavy workloads, a fractured supply chain, and labor shortages, the system is continuing to struggle as the Omicron variant brings the newest, largest wave of COVID cases yet.
These challenges are pushing U.S. health spending to new heights. A recent study from Health Affairs reported that total health spending in the U.S. increased by 9.7% in 2020 to $4.1 trillion, even as GDP declined by 2.2%. One of the biggest factors in that increase was a significant infusion of federal funding for health through COVID-19 relief legislation like the $2.2 trillion CARES Act and the $900 billion Coronavirus Response and Relief Supplemental Appropriations Act. These federal dollars provided support to health providers, helped strengthen public health infrastructure to manage the spread of the coronavirus, and sped the development and distribution of vaccines.
But while the federal government has spent heavily to navigate the current crisis, it is less clear how COVID-19 might affect overall health spending in the long term. Even before COVID-19, state and local governments have been spending an increasingly large share of their budgets on health. Ongoing challenges from the pandemic and efforts to strengthen the health system in the future could further accelerate that growth.


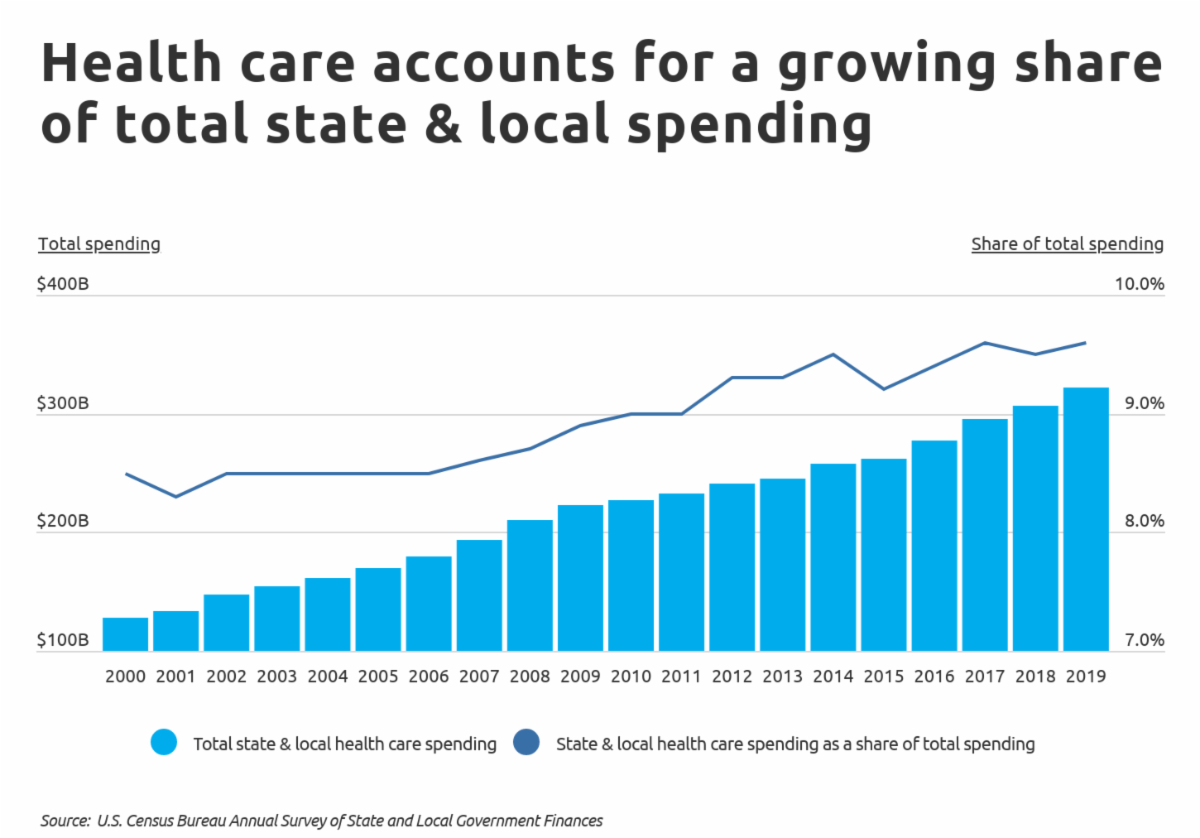
At the state and local level, total spending on health care has more than doubled over the last two decades, from $127.3 billion in 2000 to $321.7 billion in 2019 (a 70% increase after adjusting for inflation). While state and local spending has increased overall, health also represents an increasing share of the total: in 2000, health care was 8.5% of total spending, while in 2019, that figure rose to 9.6%.
A number of factors are contributing to this increased total. Some experts cite a reliance on expensive new innovations and technologies in care and administrative complexity of insurers and hospitals as a major contributor to overall costs. The aging of the Baby Boomer generation, which totals more than 70 million Americans, brings greater health needs and increases costs as well. Amid these other factors, the expansion of Medicaid under the Affordable Care Act has also increased what states must spend on their portion of the program. Although, it’s important to note that most of Medicaid spending is categorized as public welfare spending.


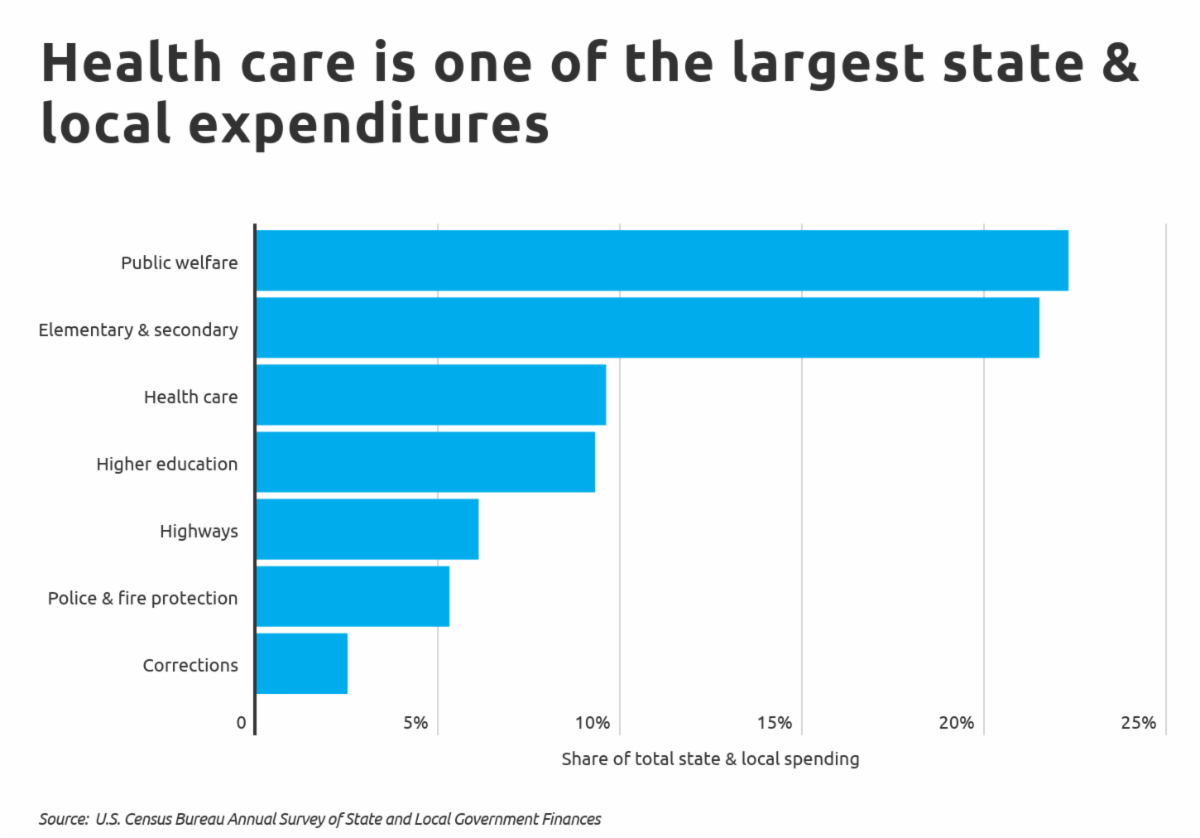
Regardless of the reason, health care is one of the primary spending categories in state and local budgets. At 9.6% of spending, health is the third-largest state and local government category behind public welfare, which includes means-tested supports like the Temporary Assistance for Needy Families (TANF) program and represents around 22.3% of state and local spending, and K-12 education, which makes up 21.5% of state and local budgets.


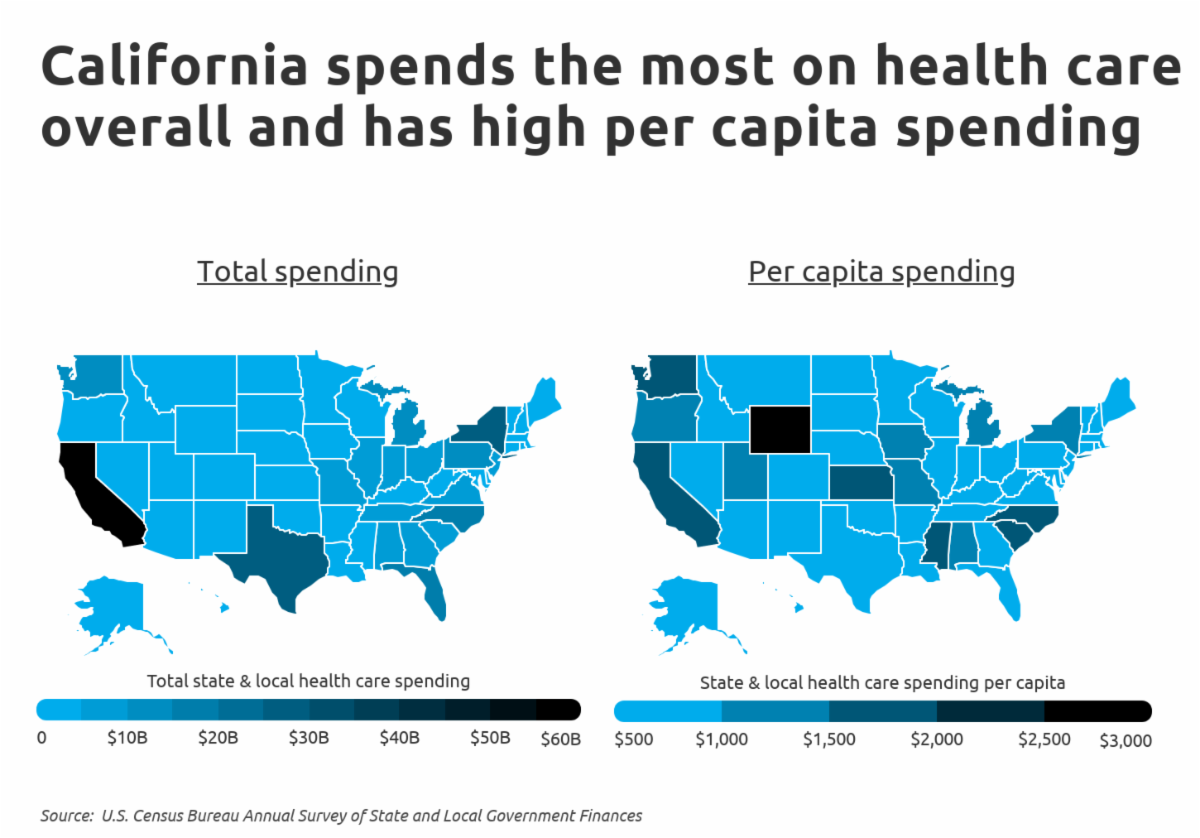
But some states spend more on health care than others. In total spending, high-population states like California, Texas, New York, and Florida lead the nation. While California ($1,533) is also among the top spending states on a per capita basis, many of the other leaders are smaller states like Wyoming ($2,978), South Carolina ($1,730), and Kansas ($1,558).
The data used in this analysis is from the U.S. Census Bureau’s Annual Survey of State and Local Government Finances. To determine the states spending the most on health care, researchers at Self Financial calculated total state and local health care spending per person using the most recent data available.
The analysis found that 11.7% of total state and local government spending in California is allocated to health care. Overall, health care spending amounts to $1,533 per person each year in California. Out of all U.S. states, California spends the 6th most on health care per capita. Here is a summary of the data for California:
- State & local health care spending per capita: $1,533
- State & local health care spending share of total: 11.7%
- Total state & local health care spending: $60,569,031,000
- Population: 39,512,223
For reference, here are the statistics for the entire United States:
- State & local health care spending per capita: $980
- State & local health care spending share of total: 9.6%
- Total state & local health care spending: $321,719,312,000
- Population: 328,239,523
For more information, a detailed methodology, and complete results, you can find the original report on Self Financial’s website: https://www.self.inc/blog/state-governments-spending-the-most-on-health-care
Mike LaFirenza writes for Lattice News Wire
Get Citizensjournal.us Headlines free SUBSCRIPTION. Keep us publishing – DONATE


