

Report from Porch.com
Housing affordability has been a major topic of concern for researchers and policymakers in recent years. Access to affordable, quality housing is associated with a variety of positive economic and social outcomes, which makes it an important tool to encourage families to thrive.
But historically, affordable housing has been out of reach for many. Low income populations and racial and ethnic minorities are often excluded from the wealth-building benefits of homeownership. People who rent are far more likely to be cost burdened by housing, according to Census Bureau data. And whenever income grows slowly—as it has recently for certain groups—housing affordability becomes even more of a challenge.
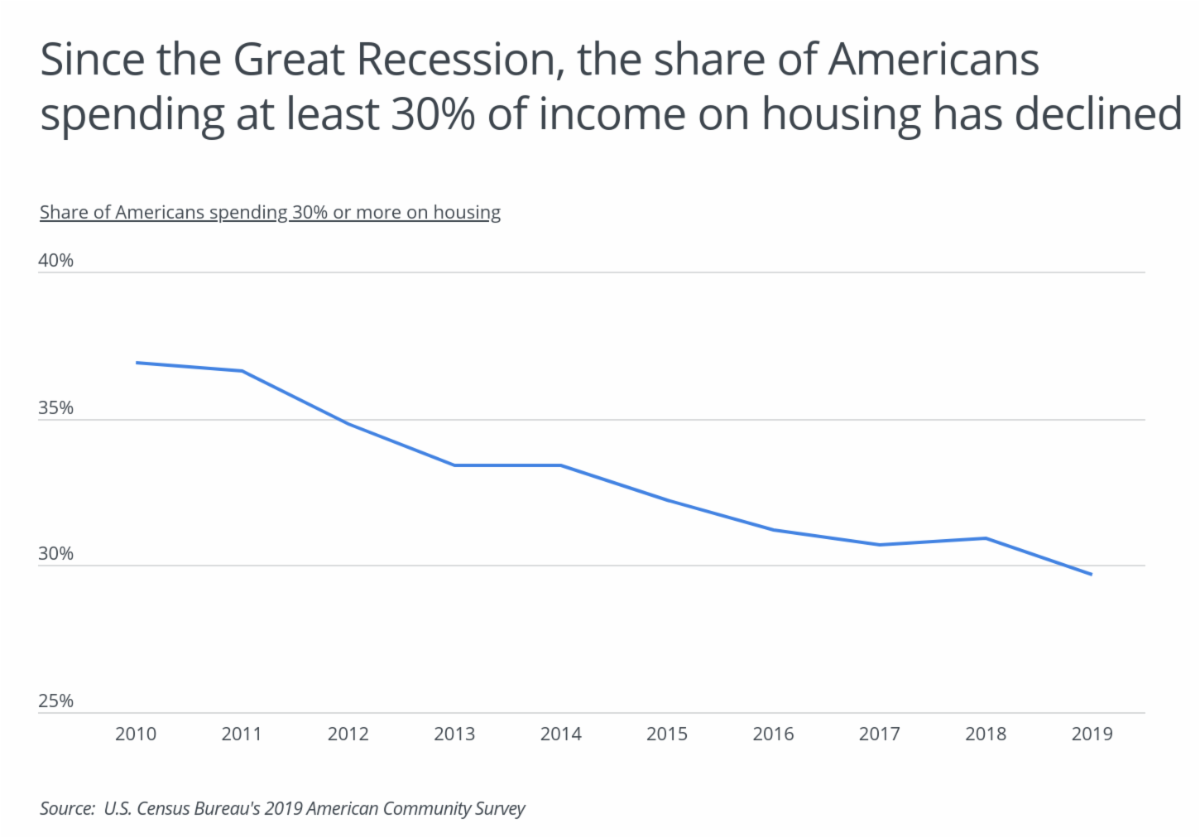
Fortunately, some data suggests that affordability has improved nationwide over the past decade. One of the key indicators that housing experts consider when evaluating affordability in the market is the share of households spending at least 30% of their income on housing. According to data from the American Community Survey, the last decade has shown positive trends on this measure. In 2010, with the U.S. still confronting the effects of the Great Recession, nearly 37% of households were spending above that threshold, but the number has declined since and dipped below 30% in 2019.
 |
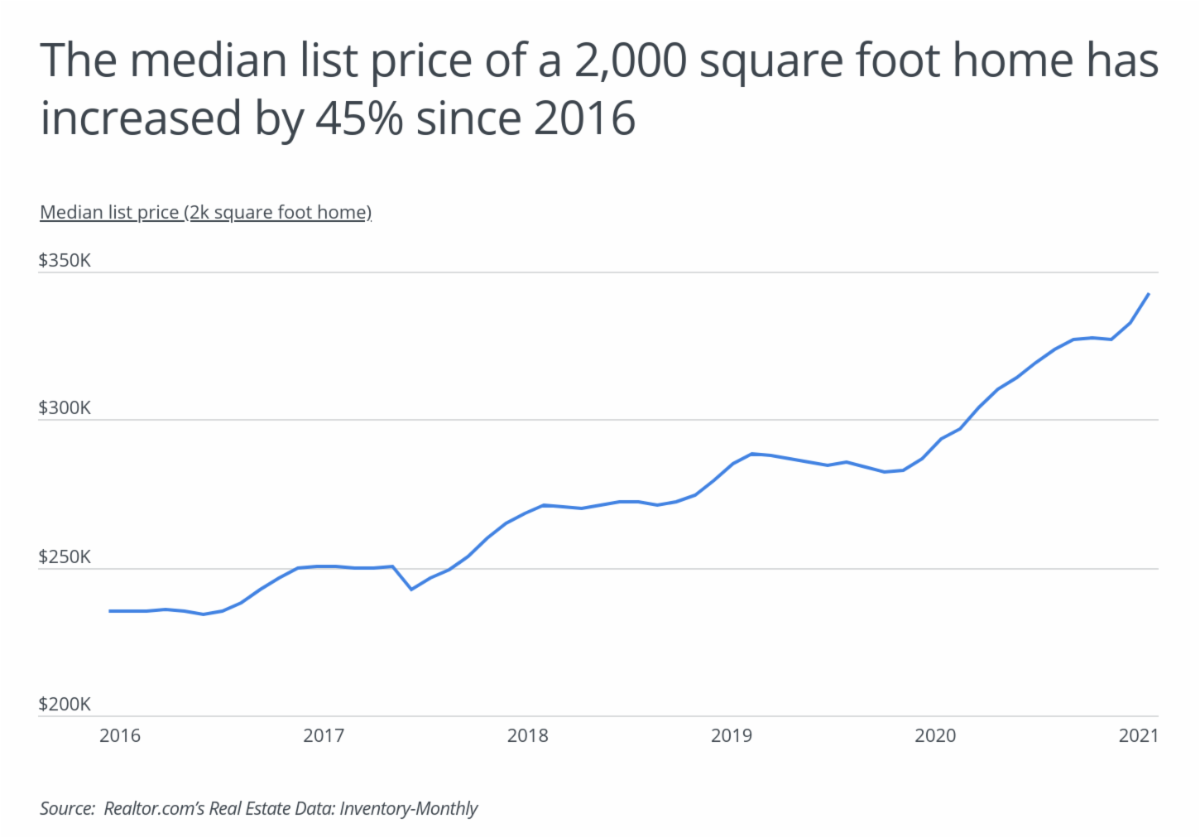
But despite the decline in the number of households spending above the 30% threshold, home prices have been on the rise in recent years, which could have implications on affordability for some populations. After the sharp drops in home values during the last recession, prices turned upward and continued to grow as the economy recovered to full strength, increasing by nearly 45% over the last five years. And notably, prices continued to rise from 2020 to 2021—nearly 20% year over year—despite the economic disruptions of the COVID-19 pandemic, thanks to record low inventory and increased demand. As prices increase, it will be worth watching whether the positive trends in housing expenditures continue. While homeowners are benefiting from the boom, those with lower incomes have borne the worst economic consequences of the pandemic and may be particularly squeezed as rent and housing prices continue to rise.
 |
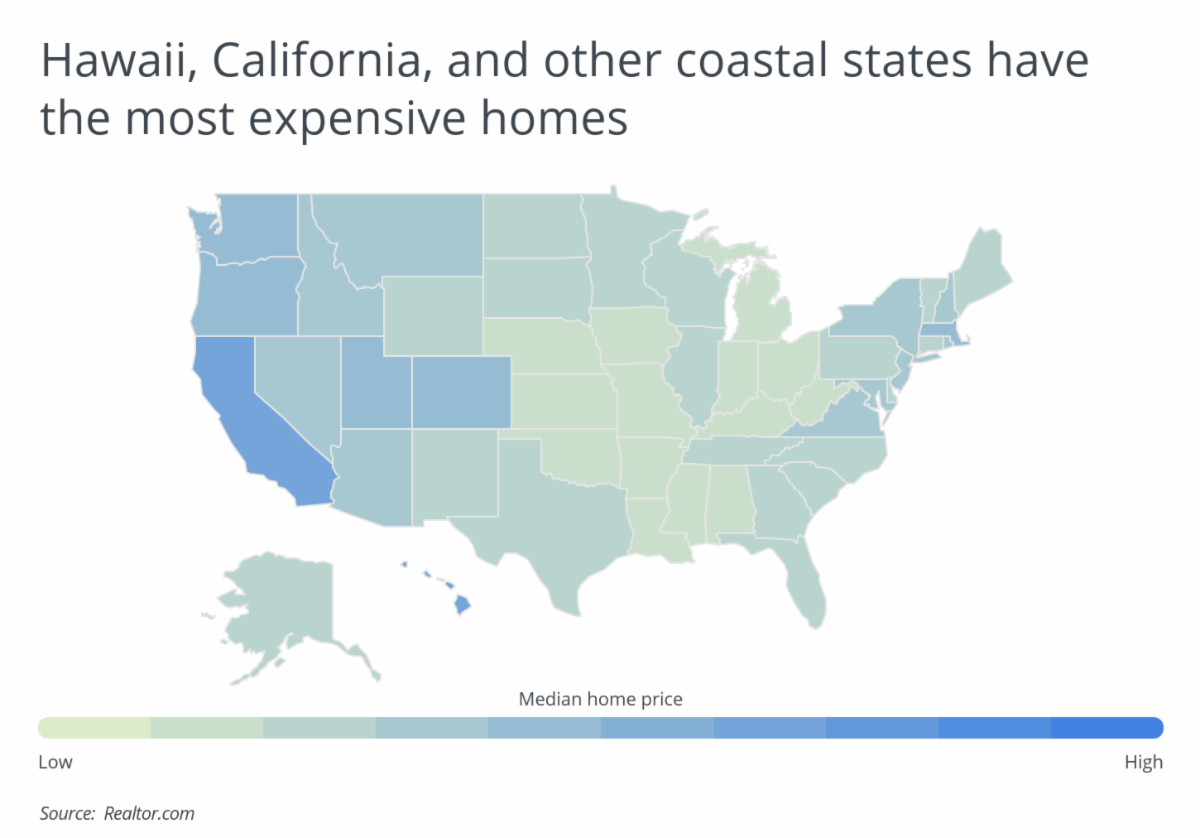
Of course, it is also the case that trends in real estate prices are highly dependent on local market characteristics, and some markets are far less affordable than others. At the state level, Hawaii tops all others for median list price, with a typical price of $1,140,723 for a 2,000 square foot home. This is largely due to its geographic isolation—which makes it more expensive to source building materials—and its limited land area—which makes it harder to increase the supply of housing stock. Other pricey states like California, Massachusetts, and Washington have their prices driven by high demand in red-hot markets like the Bay Area and Los Angeles, Boston, and Seattle, respectively. At the other end of the spectrum, less expensive markets tend to be found in parts of the South and Midwest where demand is lower and supply is less constrained.
 |
To find the areas with the most and least expensive homes and apartments, researchers at Porch used data from Realtor.com and ranked states by the typical price of a 2,000 square foot home. The researchers also analyzed data from the U.S. Department of Housing and Urban Development and the U.S. Bureau of Economic Analysis to determine the monthly price of a two-bedroom apartment and relative cost of living in each location.
The analysis found that in California, the typical price of a 2,000 square foot home is $937,375, compared to the national average of $342,719. Out of the 40 states with complete data, California has the 2nd most expensive homes. Here is a summary of the data for California:
- Price for a 2k square foot home: $937,375
- Median list price: $799,500
- Median price per square foot: $468.69
- Monthly price for a 2-bedroom apartment: $2,126
- Overall cost of living (compared to national average): +16.4%
For reference, here are the statistics for the entire United States:
- Price for a 2k square foot home: $342,719
- Median list price: $352,500
- Median price per square foot: $171.36
- Monthly price for a 2-bedroom apartment: $1,333
- Overall cost of living (compared to national average): N/A
For more information, a detailed methodology, and complete results, you can find the original report on Porch’s website: https://porch.com/advice/price-of-home-apartment-in-major-u-s-cities
![]() Get Citizensjournal.us Headlines free SUBSCRIPTION. Keep us publishing – DONATE
Get Citizensjournal.us Headlines free SUBSCRIPTION. Keep us publishing – DONATE


Yeah, the pandemic did put a dent in the super-expensive Californian real estate market, as predicted by sources like tranio.com with people leaving large cities like Los Angeles, but even that dent wasn’t enough to knock CA off the podium. But then, the decreased demand in LA and SF was partly compensated by an increase in demand in smaller cities in Western or Northern California, so…