

The City of Oxnard’s December 2021 investment report will be brief this reporting period and is required to be submitted to the City Clerk and the City Council as prescribed in California Government Code 41004.
But first, I wish to give a special thanks to the City, and staff without whose assistance this report could not be generated. This report does not show the fund balances, nor disbursements, nor total receipts of the City of Oxnard, because Oxnard Municipal Code identifies the Oxnard Finance Department is charged with producing that information. This report does reflect the monthly investment information in the similar format that has been presented in previous months along with the amounts in the Bank statements as of December 31, 2021. The following data is included in this report.
Not in this sequence, it is our intention to show the public, the Mayor, and City Council the amounts in each city bank account so that you can see the percentage of available cash to the amount actually invested. You will notice the large buildup of cash in the bank account for the city’s general business. This is the result of the anticipated rate changes, but it is the intent of the Treasurer to greatly increase the amount of cash invested so that once again it approaches 90% by year end.
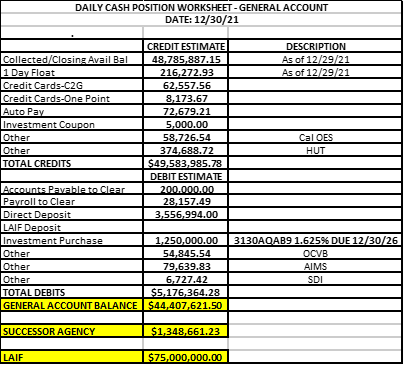
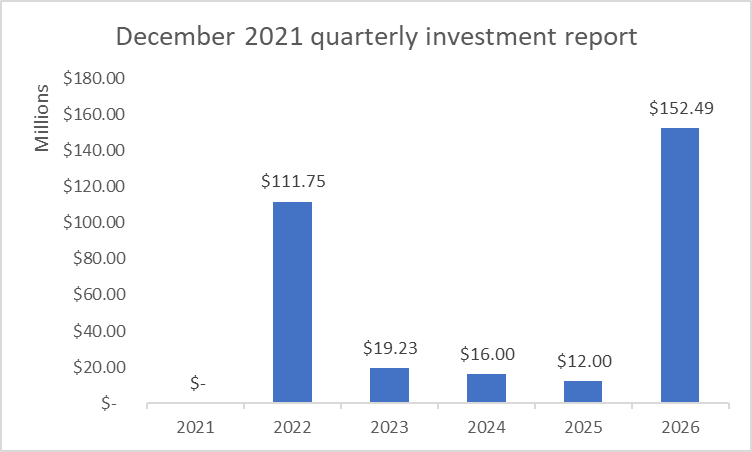
Next, we will show you in a bar chart the amounts invested separated by their maturity date or year. This will allow you to see the ladder or spread of the investments in order to generate a higher return. Third, we explain that the cash flows over the last 15 months so you can judge the management of the cash and determine whether there are periods during the year when more money is available for a short period, overnight investments versus 2-, 3-, 4-, or 5-year maturities. Fourth, we will show you the daily cash position for December 31, 2021 so that you can see how the Treasurer’s department reviews our cash balances every day to assure that the city has enough liquidity to cover its obligations.
And next, we attached the detailed list of every investment that the city currently holds as of the last day of December 31, 2021.
This information is being provided to you using both charts and graphs. The charts are presented so that the Mayor, Council and the public can begin to see the actual amounts in the city’s bank accounts at Bank of America. The graphs are created in order to show trends, and relationships that are best understood in that method of presentation. So, while this report is brief in the number of pages, we hope to respond to any question you may have.
FINANCIAL IMPACT
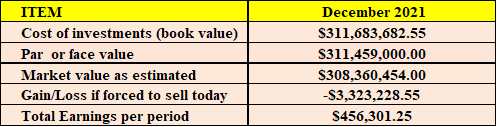
The City’s total amount invested as of December 31, 2021 at estimated market value was $308,360,454 purchased at a cost of $311,683,682.55. Because of the fluctuation upward in the market interest rates results in an estimated net market loss if we had to sell them in the market one month ago.
In a market (the city’s policy requires risk free rate of return) of fixed rates of return any instrument purchased today will decrease in value as the market interest rates increase and visa versa. Everything else being equal this means the instruments purchased when rates were lower than today’s rate now have an estimated market value below their cost thus producing the calculated estimated loss.
Cash balances on the 31st day of December 2021 in each authorized city bank account with Bank of America total $46,779,214.81 in the accounts shown below is the result of an influx of cash in the month of December of over $40 million.
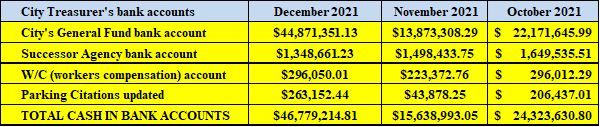
(Per Bank Statements as of December 31, 2021)
The investments have a par value of $311,459,000 with a current estimated market value of $308,360,454 were purchased months or years ago. To provide greater return we can try to reduce the amount in LAIF and spread that over the 2,3,4, and 5- year terms. Recently, LAIF was generating an average return that is moving further from the City’s average portfolio return. LAIF’s December average apportionment rate was .22%, which is less than the current GSE (government sponsored enterprises) rates and less than our portfolio yield. Reducing the amount in LAIF would, however, reduce the liquidity of the portfolio.
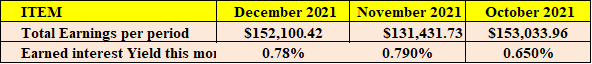
So now the cost of the investments, the face value, and the market value as of December 31, 2021 and the prior 2 months is provided so at a glance you can see the summary of the entire portfolio, the risk, and the earnings with the current yield on a 365-day basis of .78% year to date. The total interest earnings for the calendar year 2021 was greater than initially estimated and equaled $1,845,568.64 (USBank, LIAF, and Ventura County investments)
Now when we look back at the monthly cash flows of the recent years, we found that the month with the highest cash outflow was December 2018 with an outflow of $37.4 million. And the fact that we had $75 million invested in LAIF, which can be drawn down within one day, means there should be no normal condition that would require the Treasurer to sell investments before their maturity. Before we reveal the details, we want to know the level of efficiency in our investment team. But, first we look to see how much cash is available, how much cash is invested to determine the efficiency of the team. The goal is to invest 100% of available cash, and we know that for normal operations we should retain a daily balance of $3-5 million in the bank accounts. In the last 60 days the City has received in excess of $55 million inflow of cash making it difficult to maintain a reasonable investment strategy with the projection for cash outflows unavailable at this time.
The daily cash report for the last working day in December shows sufficient available cash to satisfy the city’s booked short-term obligations though somewhat reduced from prior months.
So, when we look at the detail, we see that the city is investing as a percent of total available cash. Bank of America provides a return of .19%. Thus, our efficiency rating is now 87.3%.
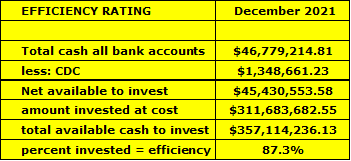
EFFICIENCY RATING
The bar chart below, shows the maturities of City’s investment portfolio and reflects the fact that as our older instruments are being called early, we find the need to acquire shorter term notes unless we can guarantee a rate of .19 % or higher as explained above.
![]() Get Citizensjournal.us Headlines free SUBSCRIPTION. Keep us publishing – DONATE
Get Citizensjournal.us Headlines free SUBSCRIPTION. Keep us publishing – DONATE

