
by Gilbert Berdine
One can find the entire range of opinion on Covid vaccines if one looks hard enough. Some people claim that if everyone were vaccinated, Covid would be eliminated. Others claim that Covid vaccines are making the problem worse. I will show, based on US data, that the truth is somewhere in between: the vaccines offer a modest benefit but are not a panacea.
There is robust data from all 50 US states and the District of Columbia on Covid cases and deaths. I am not going to discuss whether the definitions of Covid cases and Covid deaths are perfect; I will use the current definitions as they are. Data on vaccination rates are available from usafacts.org. Data on Covid cases and deaths are available from Worldometer. These data provide 51 data points to correlate vaccination rate and consequences from Covid-19.
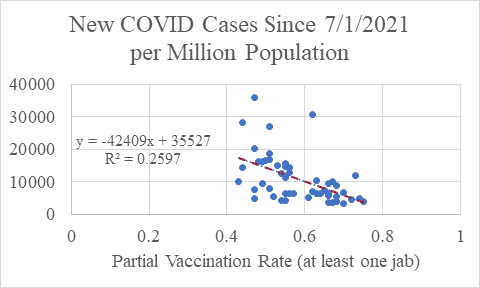
Figure 1:


Figure 1 illustrates the scatterplot of Covid-19 cases per million population vs. partial vaccination rate. The case numbers were calculated as the difference between total Covid-19 cases on 8/20/2021 and 7/01/2021. July 1, 2021 is approximately the time when cases began to noticeably increase due to the Delta variant in the US. The partial vaccination rate is the percentage of the population that received at least one jab of a Covid-19 vaccine. Scatterplots using complete vaccination rates (percentage of population that received all of the required jabs for a Covid-19 vaccine) or deaths attributed to Covid-19 have a very similar appearance. The graphs demonstrate several important points.
Point 1: There is some efficacy to the vaccine in preventing Covid-19.
A negative correlation between vaccination rate and Covid-19 cases or deaths is apparent from the scatterplots. The correlations, however weak, are apparent from even a casual inspection of the plots. As vaccination rate increases, Covid-19 events decrease.
Point 2: The correlations between Covid-19 events and vaccination rates are weak.
Just as a casual inspection of the plots demonstrates a trend, a casual inspection indicates that the trend is weak. In other words, vaccination rate is not the entire explanation for Covid-19 events and may not even be the most important determinant of Covid-19 events. The R2 for Covid-19 cases vs. partial vaccination rate was 0.26, for Covid-19 cases vs. complete vaccination rate was 0.39, for Covid-19 deaths vs. partial vaccination rate was 0.26, and for Covid-19 deaths vs. complete vaccination rate was 0.36. These are weak correlations. Vaccination rate may not even be the most important variable as the majority of variance is due to something other than vaccination rate. North Dakota is that point at the lower left of the plot. North Dakota has nearly the lowest vaccination rate and also nearly the lowest case rate as well as death rate. Hawaii is that point with almost the highest vaccination rate and a slightly above average case rate.
Point 3: The vast majority of people have been unaffected by the Delta variant.
Louisiana had the worst number of Covid-19 cases since July 1, 2021 at about 36,000 per million population. That means that 96.4% of the population in Louisiana were not a new Covid-19 case. Louisiana also had the most Covid-19 deaths since July 1, 2021 at about 252 deaths per million population. That means that 99.7% of the population in Louisiana have survived the Delta variant.
Point 4: The numbers to treat are very high (poor).
We can compute the numbers to treat to avoid a single event from the slopes of the regression lines. For new Covid-19 cases vs. partial vaccination, the slope was -42,409 cases per million population per total population. For new Covid-19 cases vs. complete vaccination, the slope was -54,299 cases per million per total population. For new Covid-19 deaths vs. partial vaccination, the slope was -319 deaths per million population per total population. For new Covid-19 deaths vs. complete vaccination, the slope was -393 deaths per million population per total population. Since the total population is 1 million per million population, the numbers to treat can be calculated as 1 million divided by the slope. From these data, it takes over 23 partial vaccinations to prevent a single case of Covid-19, over 18 complete vaccinations to prevent a single case of Covid-19, over 3,134 partial vaccinations to prevent a single death from Covid-19, and over 2,544 complete vaccinations to prevent a single death from Covid-19 at the current time.
Point 5: The utilitarian rationale for mandatory vaccination is very weak.
The lowest compliance for any US state was 0.44 percent partial vaccination rate. Mandatory vaccine policies are, therefore, going after at most 56% of a group. An employer would have to have a workforce of at least 4,543 people to have an average expectation of preventing a single death from Covid-19 by forcing all employees to complete vaccination. It is quite likely that significant complications from the vaccine may exceed the average expectation of deaths prevented. It is quite possible that deaths from the vaccine may exceed the average expectation of deaths prevented. Government agencies, including the CDC, should stop exaggerating the benefits and lowballing the risks of these vaccines. At a minimum, everyone deserves the right to informed consent. Informed consent does not include lying about the risks and benefits. No Institutional Review Board would approve a clinical study conducted in the same manner as these vaccine programs. Rather than blaming people who choose not to be vaccinated for a virus that is largely beyond the control of any human action, government agencies should be studying North Dakota to see what they are doing right and Hawaii to see what they are doing wrong, because the answers are not vaccination rates.


