


The annual ritual known as Black Friday takes on renewed significance in 2023. This year’s shopping extravaganza will serve as a litmus test for the strength of the American consumer and, consequently, the broader health of the US economy. As citizens continue to grapple with inflationary pressures amid rising interest rates, growing unemployment, and declining personal financial health, consumer spending is among the few sources of current economic expansion.
Inflation has become the defining feature of the consumer landscape of the last few years. The economic shadow cast by monetary policy interventionism in the face of the COVID pandemic. It saps consumers’ purchasing power, undermines retailers’ pricing strategies, and roils both economic calculation and financial management. Much has been said at AIER about the increasingly questionable state of spending capacity over the past quarter or so.
Although Black Friday is a day of discounts, rebates, and other sales promotions, examining the price changes in the most-marketed merchandise categories may provide some insights as to what consumers face this year.
Empirically, the categories of goods that are the most frequently discounted on Black Friday include the following:
- Audio Equipment
- Cable Satellite and Live Streaming TV Services
- Consumer Appliances
- Cosmetics, Perfume, Bath, Nail Preparations and Implements
- Footwear
- Furniture and Bedding
- Hair, Dental, Shaving, and Miscellaneous Personal Care Products
- Household Equipment and Furnishings
- Jewelry And Watches
- Men’s and Boys’ Apparel
- Personal Computers and Peripheral Equipment
- Sports Equipment
- Sports Vehicles Including Bicycles
- Telephone Hardware, Calculators, and Other Consumer Information Items
- Televisions
- Tools Hardware and Supplies
- Toys
- Video Equipment
- Video Game Hardware, Software, and Accessories
- Women’s and Girls’ Apparel
An index composed of the prices of those goods over the last decade would track as follows.
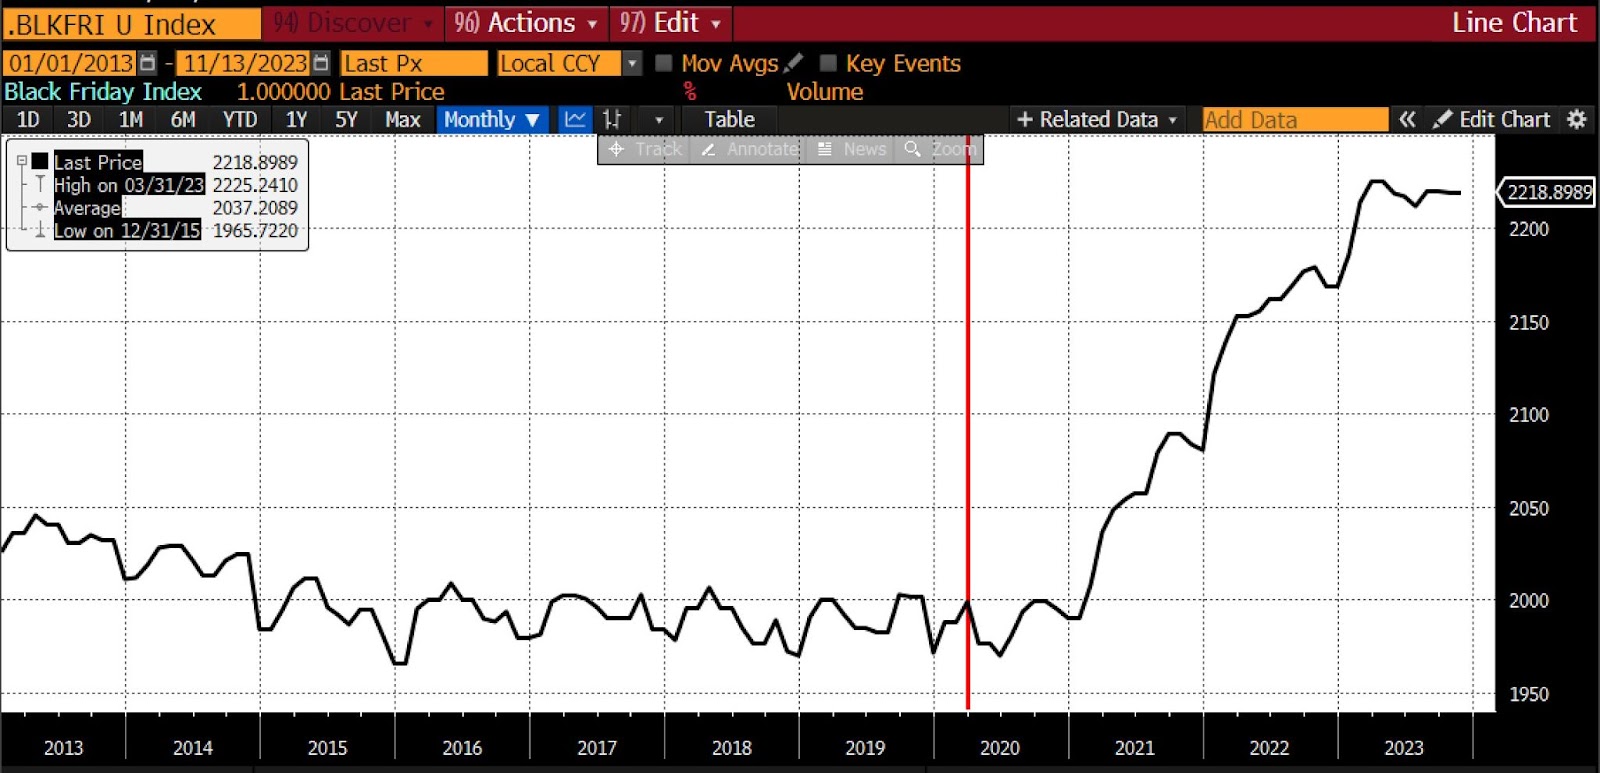
(Source: Bloomberg Finance, LP)
Several elements are clear from the chart. First is the high degree of seasonality in the aggregate components. Second is the mildly deflationary trend from 2013 through 2019, owing to the predominance of consumer technologies among the Black Friday basket constituents. And of course, the rapid rise in prices starting in late 2020 is driven by monetary policy (red vertical line) and fiscal stimulus. The changes are shown in the table below.
| Black Friday | ||
| End period | Basket | Change (yoy) |
| 11/13/2023 | 2218.899 | 2.30% |
| 12/30/2022 | 2169.025 | 4.27% |
| 12/31/2021 | 2080.27 | 4.60% |
| 12/31/2020 | 1989.766 | 0.97% |
| 12/31/2019 | 1970.916 | 0.08% |
| 12/31/2018 | 1969.308 | -0.74% |
| 12/29/2017 | 1983.95 | 0.21% |
| 12/30/2016 | 1979.687 | 0.71% |
| 12/31/2015 | 1965.722 | -0.91% |
| 12/31/2014 | 1983.765 | -1.35% |
| 12/31/2013 | 2010.967 | -0.45% |
The prices of the combined Black Friday goods basket rose 4.6 percent in 2021 and 4.27 percent in 2022, while the average inflation rate (CPI) in the United States was 4.70 percent in 2021 and 8 percent in 2022. Caution should be taken in inference drawn, however, as the prices changes in specific categories of goods have varied and are smoothed by aggregation. The overall increase in this basket of goods is 12.53 percent since 2019.
Black Friday is known for little, besides discounts and melees. But the combination of inflation (as depicted by the basket), the increasingly beleaguered nature of the consumer, and retailers’ tactic of raising prices in the weeks and months before Black Friday to recoup most of the pending discounts may result in both lower sales and shallower savings this year. (The growing adoption of restocking fees by retailers adds a new source of expense to the consumer experience.)
Consumer spending accounts for approximately 70 percent of GDP calculations, and is, for tracking US business cycles, an analytical imperative. The American consumer has consistently defied expectations by maintaining robust spending patterns throughout 2022 and 2023. But with ongoing inflation eroding purchasing power, a declining rate of saving, rising borrowing costs, and a continuing credit contraction, constraints on potential consumption are becoming increasingly formidable. We are not predicting a Black Friday bomb, yet it seems prudent to expect a softer spending environment going into the last five weeks of the year. At the very least, Black Friday and the 2023 holiday season will provide an occasion to pick up valuable insights into the trajectory of US spending and consequently economic growth going into 2024.
Peter C. Earle

Peter C. Earle is an economist who joined AIER in 2018. Prior to that he spent over 20 years as a trader and analyst at a number of securities firms and hedge funds in the New York metropolitan area. His research focuses on financial markets, monetary policy, and problems in economic measurement. He has been quoted by the Wall Street Journal, Bloomberg, Reuters, CNBC, Grant’s Interest Rate Observer, NPR, and in numerous other media outlets and publications. Pete holds an MA in Applied Economics from American University, an MBA (Finance), and a BS in Engineering from the United States Military Academy at West Point.

