

Mike LaFirenza
Throughout the second half of 2021, economic observers have expressed concerns that the U.S. economy is in the midst of an inflationary period. Ongoing supply challenges due to the COVID-19 pandemic have driven up costs in many key consumer spending categories. Aggressive federal stimulus measures have pumped more money into the economy throughout the pandemic. Workers’ wages are rising, particularly at the lower end of the wage scale, as many businesses continue to struggle to attract and retain labor.
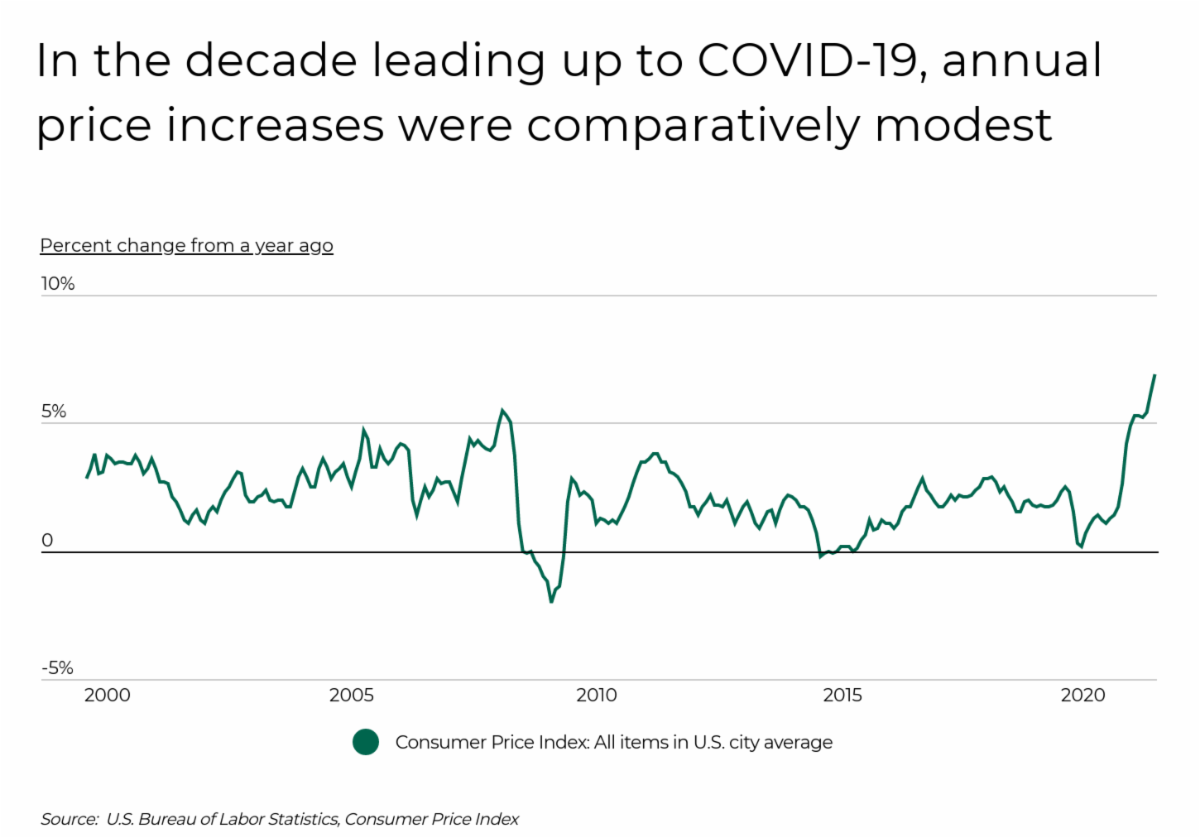
These factors have created inflationary conditions, where the amount of money available in the economy is exceeding the availability of goods on which to spend. The result as of late has been successive months of higher-than-usual increases in consumer prices, as measured year-over-year from 2020 to 2021: 5.4% in September, 6.2% in October, and 6.9% in November. Earlier in 2021, some economic experts—including the U.S. Federal Reserve—called this period of inflation a transitory one that would be corrected as supply chain issues worked themselves out. The consensus now is that this period of inflation is likely to have a long-lasting effect on prices that will raise Americans’ cost of living, and the Federal Reserve recently shifted away from the use of the term “transitory.”
Current levels of inflation have raised alarm in part because the pace of price increases is much greater than it has been in recent years. The Federal Reserve typically sets monetary policy in the U.S. to target an annual inflation rate of 2%, and for most of the decade since the last recession, inflation has remained below that level. But beginning in June 2021, the rate of year-over-year price increases has topped 5% each month, and the rate of month-to-month increases has shown little sign of slowing down.
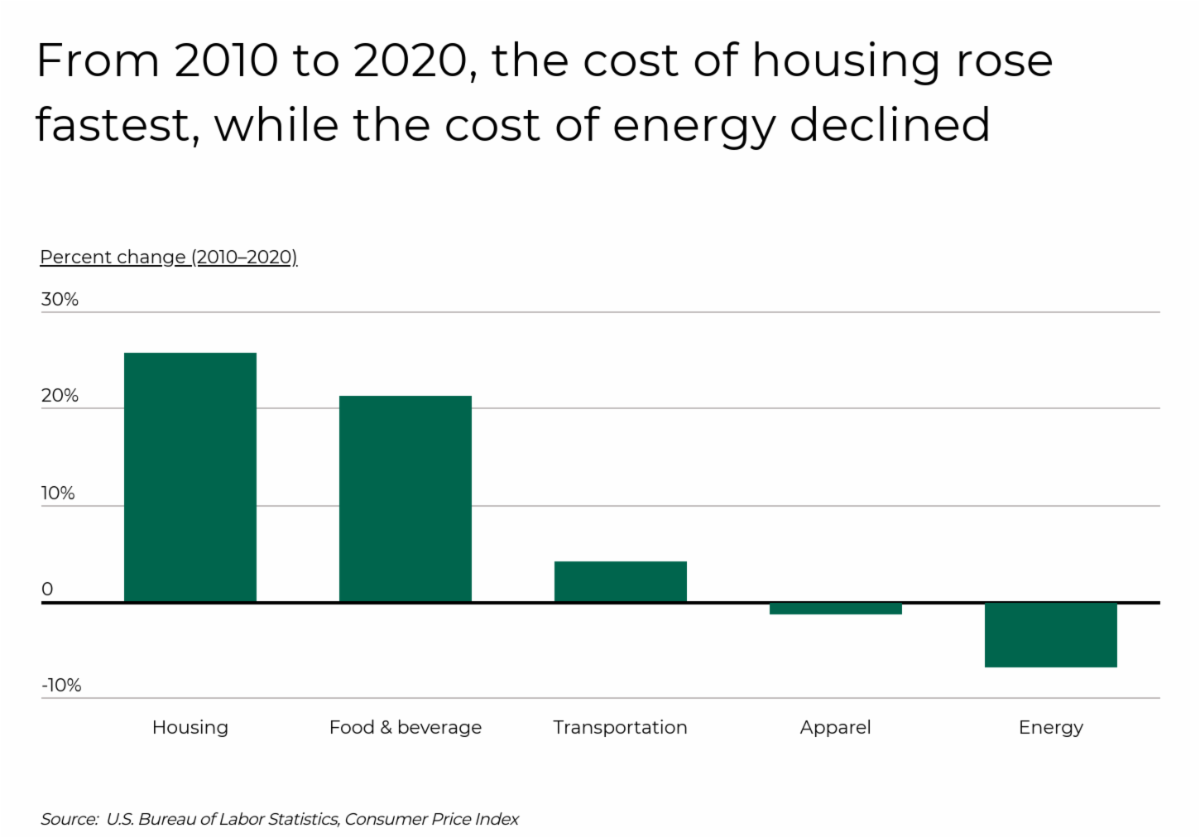
The recent inflationary period also looks different from recent years in terms of the spending categories that have been driving inflation overall. From 2010 to 2020, housing and food and beverage saw the greatest increases in cost, with increases of 25.7% and 21.2%, respectively, while transportation had a much lower 4.1% increase and energy saw a decrease of 6.8% over the same period. But in recent months, transportation and energy have seen some of the fastest increases. The transportation sector has been hard-hit by supply chain issues, which has raised the cost of new and used vehicles, while volatility in supply and demand throughout the pandemic has contributed to the recent spike in energy prices.
One other difference between the current period of price increases and recent years is the locations where price increases are taking place. Over the last decade, many of the places where the cost of living grew the most were economically prosperous states that have seen growth in high-paying jobs and attracted more residents to their major metros, like Washington (Seattle), Oregon (Portland), and Massachusetts (Boston). Price increases now, however, appear to be a nationwide phenomenon, and for areas where the rate of job and wage growth is slower, household expenses may take up an increasingly large share of workers’ earnings.
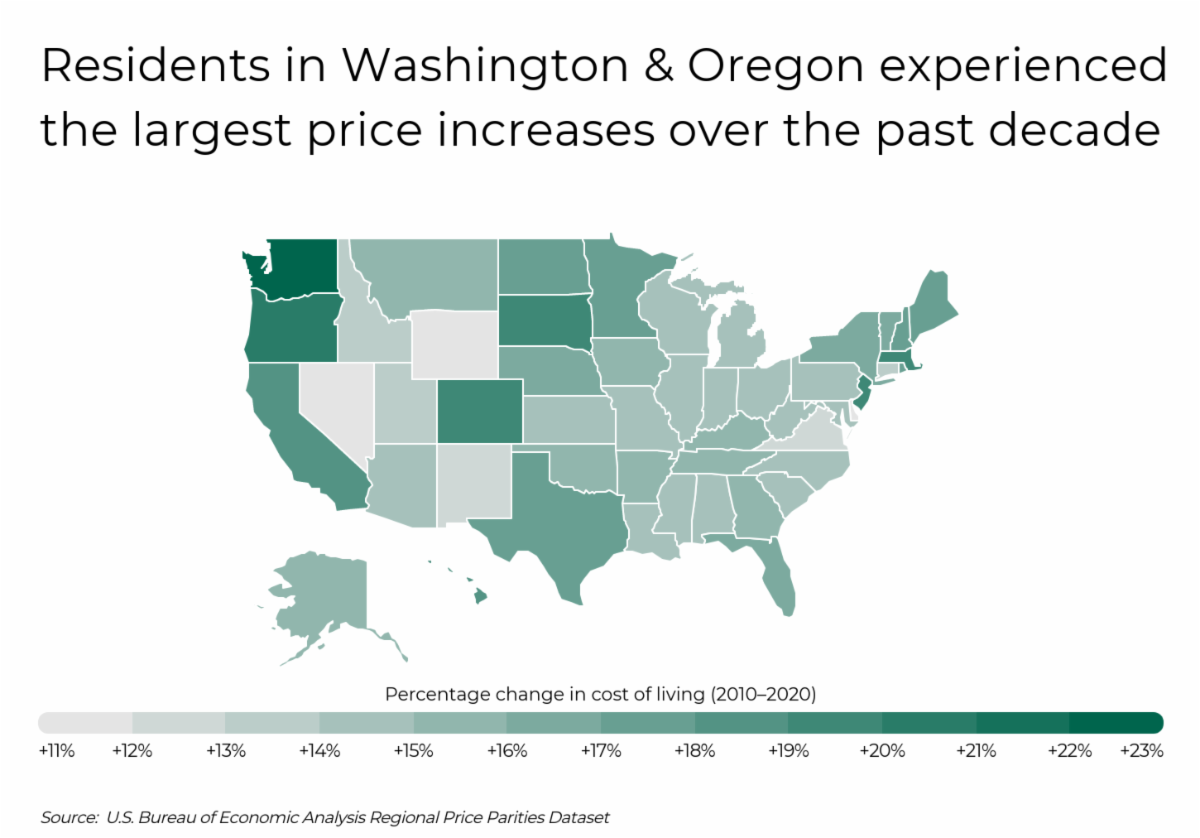
The data used in this analysis is from the most recent U.S. Bureau of Economic Analysis Regional Price Parities Dataset (RPP), released in December 2021. To determine the locations with the largest increases in living cost over the past decade, researchers at Filterbuy calculated the percentage change in RPP between 2010 and 2020, adjusted for the U.S. Personal Consumption Expenditures Price Index over the same time period. In the event of a tie, the location with the higher RPP in 2020 was ranked higher. Regional price parities measure the differences in price across locations relative to the national average. They are calculated annually using a wide range of items from the Consumer Price Index as well as housing data from the American Community Survey.
The analysis found that residents of California experienced an increase of 18.4% in the cost of living between 2010 and 2020. Out of all states, California saw the 7th largest increase in the cost of living over the last decade. Here is a summary of the data for California:
- Percentage change in cost of living (2010–2020): +18.4%
- Overall cost of living (compared to average): +10.4%
- Cost of goods (compared to average): +6.4%
- Cost of housing (compared to average): +59.8%
- Cost of utilities (compared to average): -2.8%
For reference, here are the statistics for the entire United States:
- Percentage change in cost of living (2010–2020): +16.2%
- Overall cost of living (compared to average): N/A
- Cost of goods (compared to average): N/A
- Cost of housing (compared to average): N/A
- Cost of utilities (compared to average): N/A
For more information, a detailed methodology, and complete results, you can find the original report on Filterbuy’s website: https://filterbuy.com/resources/cost-of-living-in-us/
Mike LaFirenza writes for Lattice News Wire
Get Citizensjournal.us Headlines free SUBSCRIPTION. Keep us publishing – DONATE

